

New tools help fight wildfire with satellite imagery
July 6, 2017
Joshua Hartman
907-474-5823
Download text and photo captions here.
New tools from satellite images are helping locate Alaska wildfires and forecast weather to protect firefighters.
In Alaska's remote areas, a wildfire might not be spotted immediately by residents or pilots. While such a fire may be out of sight, its heat will show up in satellite images.
This summer, the Geographic Information Network Alaska at the University of Alaska Fairbanks Geophysical Institute is creating a new type of satellite image that reveals fire details. It forwards the images to the U.S. Bureau of Land Management, which provided GINA with grant money for the work, and the National Weather Service.
“We can learn about a fire, sometimes, hours before it would have become apparent because of its remoteness,” said Sharon Alden of BLM. “It lets us see what is going on without actually being there.”
Alden is a predictive services meteorologist with the BLM's Alaska Fire Service. She helps fire managers plan for firefighting and safety based on the weather and its impacts on active wildfires.
The new images are useful for more than just detecting fires.
When fire crews go out to fight wildfires, an incident meteorologist, referred to as an IMET, joins them in the field. During morning briefings, the IMET shares how winds, humidity or rain will affect the fire and helps plan the firefighters' attack.
This is particularly important since weather — like a shift in wind that pushes the fire in a new direction — can create danger, according to National Weather Service meteorologist Melissa Kreller.
“If it’s a real active fire, the fire itself can create its own weather,” she said. Intense fires can form thunderstorms, complicating the forecast.
Satellites fly above Alaska multiple times daily, beaming data down to satellite dishes operated by GINA's staff. They process the data into images, called products, and send these to meteorologists, who use the information to predict how fires will behave.
“As soon as this satellite flies over … and takes a picture of Alaska, the clock starts,” said Eric Stevens, science liaison for GINA and a former National Weather Service forecaster. “As soon as possible, you need to get that imagery in front of the eyeballs of the meteorologists.”
From satellite to weather service, the process takes roughly 15 minutes — processing the data can take anywhere from under five to almost 30 minutes, according to Tom Heinrichs, director of GINA.
“If GINA wasn’t here, the delay could be like two hours later,” said Kreller. In that time, the weather might change.
For more than a decade, GINA has used data collected by NASA’s Terra and Aqua satellites. These satellites take pictures of the Earth using different frequencies of the light spectrum, including parts of the infrared spectrum, which humans cannot see.
About five years ago, NOAA launched a new satellite that carries a sensor called the Visible Infrared Imaging Radiometer Suite, or VIIRS. This new sensor takes higher-resolution images on more frequencies.
“With the new satellites being launched, there are more and more slices of the spectral pie that you can take a taste of,” Stevens said.
In the past, weather forecasters received five channels of data. Today, GINA can provide 22 VIIRS channels, allowing forecasters to make better predictions.
Stevens said individual channels can be combined into “multispectral products,” or images. One example is an “RGB.” The term refers to the red, green and blue pixels that produce every color on a computer screen.
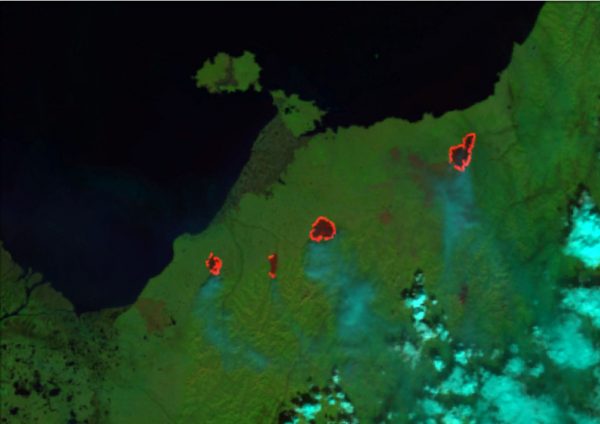
One such image is the “fire temperature RGB." It makes less-intense fires look red, moderate fires look yellow or orange, and large, hot fires look white or cyan. This type of image allows the forecaster to see through smoke and makes the structure of a fire distinct.
More complicated images can be difficult to read without training, Stevens said.
“It’s not intuitive the first time you look at one of these new products,” Stevens said. “If you’re a forecaster you sit down and you go ‘Holy cow, what’s this mess? It’s the aftermath of an earthquake at the paint store!’”
Once forecasters learn how the image is formed and the science behind it, they can figure out what new colors mean. These newer images make the process of identifying and describing fires and other weather events easier and more efficient.
“Today, weather service forecasters have, on their screens, the fire temperature RGB,” Stevens said. “This wasn’t true last year … that’s now a tool that they have in their toolbox that they didn’t have before.”
ADDITIONAL CONTACT: Eric Stevens, (907) 474-7022, eric@gina.alaska.edu