Submarine 'airplane' revolutionizes measurement of seawater content
August 9, 2018
Lauren Frisch
907-474-5350

This is the second story in a four-part series highlighting the main research groups that participated in the May 2018 expedition.
Of all the scientists on the LTER cruise, CFOS researcher Seth Danielson has the coolest gadget. Danielson is one of the proud operators of an Acrobat instrument, which he described as the underwater version of an airplane.
The Acrobat is towed behind Sikuliaq on an approximately 200 meter-long tether that powers the instrument and sends data back to the ship, allowing researchers to see current conditions in the water in real time.
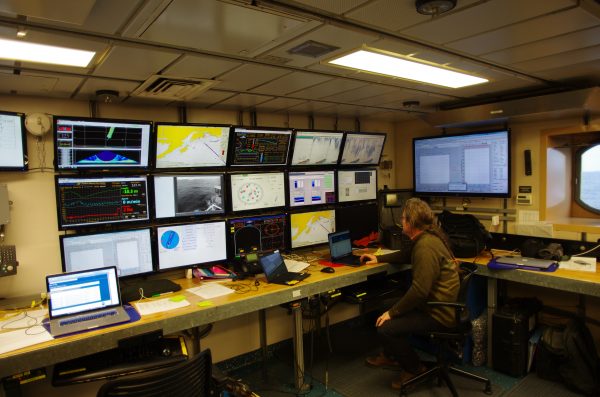
Danielson and his technicians can monitor the Acrobat’s activity from Sikuliaq’s computer room. Using a flight control computer, they can change the pitch of the Acrobat’s wings to make the instrument fly up or down in the water. There’s no autopilot, so the instrument must be watched at all times to ensure the Acrobat does not crash into the seafloor, or become unstable if it is pulled through the water too quickly.
Danielson is a physical oceanographer who studies how ocean circulation, temperature and salinity vary regionally and over time, and how such variables impact the ecosystem. This has important implications for how nutrients are carried around by ocean currents, how oil and other pollutants are dispersed, and what kinds of fish and marine mammals can be sustained in different regions. Danielson’s team is using the Acrobat to measure temperature, salinity and other variables in the Gulf of Alaska.
Researchers have been studying the region’s physics for nearly 50 years. In the past, physical oceanographers were confined to sampling using conductivity, temperature and depth instruments. CTDs are lowered from the ship to the seafloor and collect water samples at specific depths on the way back up to the surface. On past Seward Line expeditions, CTD casts have been taken about five or 10 miles apart.
“The Acrobat flies down to about 60 meters below the ocean surface and back up in about three minutes,” Danielson said. “With the ship’s movement, we end up getting new data on each layer of the ocean about every 300 meters. Collecting such high-resolution data is important for understanding the details of how organisms interact with their environment.”
Working with higher-resolution data opens up the potential to catch a better glimpse of the region’s complexity and focus on new areas of study.
“For example,” Danielson said, “we can begin to look at terrestrial-origin freshwater and use the Acrobat to study where that freshwater goes and how it mixes with other ocean water.”
Additional space available on Sikuliaq’s deck made it possible to use the Acrobat on this cruise. Besides the Acrobat, Danielson brought computer systems onboard to direct the instrument and collect data, as well as the specialized cable and a large winch that connects the Acrobat to the ship and deploys it into the water. The ability to house and run this technology has not been possible on the smaller ships researchers have used in the past.
The physical oceanographers on this expedition also used a high-resolution sonar system to begin creating a meter-scale topographic map of the seafloor. At present, it is still very patchy in many portions of the study region, but the researchers can continue to fill it in during subsequent expeditions.
“This will be beneficial to future cruises as we move forward,” Danielson said. “We’ll be studying this region’s ecosystem for the foreseeable future, and having a high-resolution map will help us better pinpoint regions to focus on.”
The next story in this series looks at the nutrients that sustain the base of the food web in the Gulf of Alaska.
Read part 1 of the series here.